All projects21 / 43
AI & Data
Superstore Analytics
Shipping, loyalty & profit analysis
At a glance
- Discipline
- AI & Data
- Key features
- 4 delivered
- Screens
- 4 in gallery
PythonPandasNumPyMatplotlibSeaborn
Superstore Analytics
Overview
An exploratory analytics workflow that turns transactional sales data into insight on shipping performance, loyalty and profit risk.
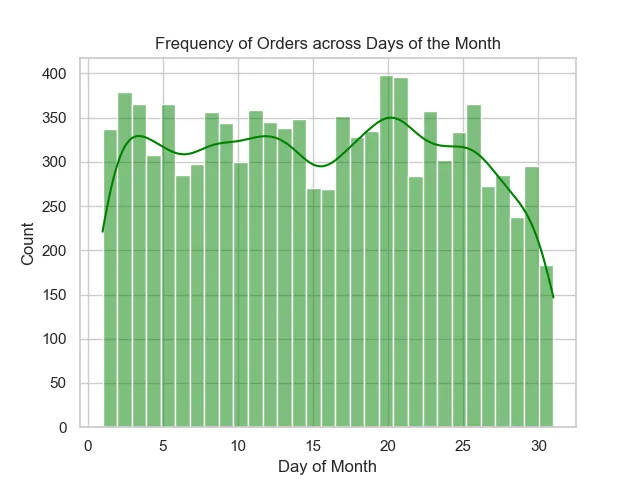
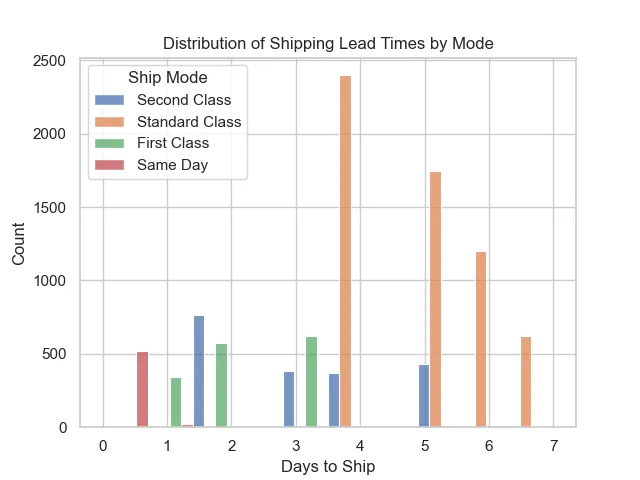
Pandas pipelines engineer lead-time and order-day features, then aggregate them by region, shipping mode, city and category.
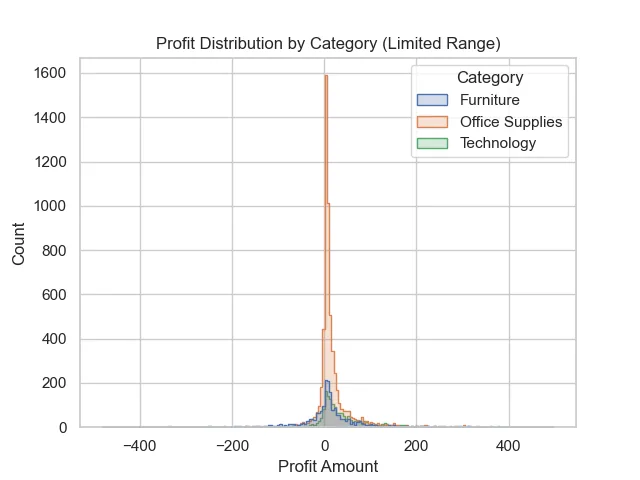
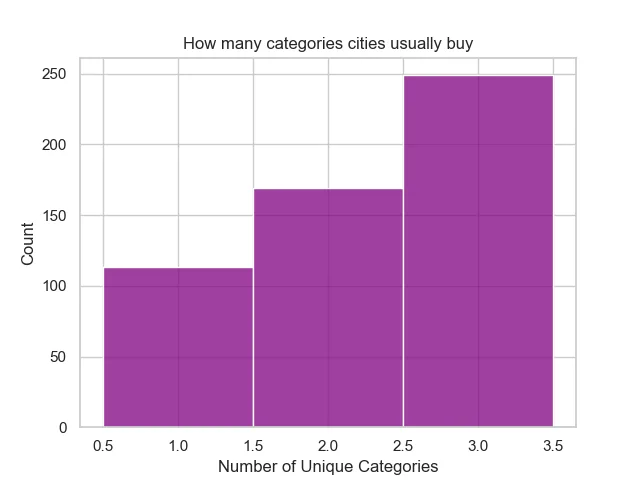
Matplotlib and Seaborn visualisations expose delivery patterns, repeat-purchase rates and profit variability.
Key features
- 01Lead-time analysis by region and mode
- 02Repeat-order rates by city
- 03Category variety and profit variability
- 04Exported visual reports
Gallery
Inside the product
4 screens
Up next22 / 43
AirOps Runway Dashboard
Tactical airport operations interface